Category
- Get Started
- Trading Academy
- Exchanges Guidelines
- Example Strategies
- Master TradingView
Short Term RSI and SMA Percentage Change
This strategy aims to enter the trade when the coin is experiencing an upwards trend with momentum behind it.
This strategy utilises common indicators like RSI and moving averages in order to enter and exit trades. The Relative Strength Index (RSI) is a momentum indicator that has a value between 0 and 100, where a value greater than 70 is considered overbought and a value less than 30 is oversold. If the RSI value is above or below these values, then it can signal a possible trend reversal.
The second indicator used in this strategy is the Simple Moving Average (SMA). The SMA used is an arithmetic moving average calculated by adding recent prices and then dividing that figure by the number of time periods in the calculation average. For example, one could add the closing price of a coin for a number of time periods and then divide this total by that same number of periods. Short-term averages respond quickly to changes in the price of the underlying coin, while long-term averages are slower to react.
Entry

This strategy focuses on buying the coin when it is in an uptrend with momentum behind it.
As shown above, there are three conditions that must be met in order for the strategy to enter a trade. The first checks if the RSI is greater than 50, which means that the coin is approaching the ‘overbought’ region on the RSI scale. This is the first indication that the coin has entered an uptrend.
The second condition assesses whether the SMA9 is greater than the SMA100, further showing that the coin is entering on an uptrend.
Finally, the last condition of the rule determines if the SMA of the coin has increased by 6% within the timeframe. When met, it signifies a short-term increase in prices of the coin which can mean a breakout in price.
These three conditions being met signifies that the coin is in an uptrend with strong momentum behind it.
Exit
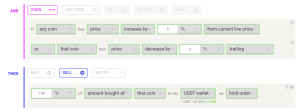
The strategy exits its position when 2 conditions have been met.
The strategy includes a simple trailing stop loss and take profit which both act at 5%. This is simple, yet effective as the backtesting results show.
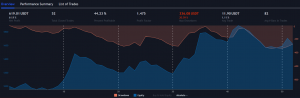
Backtesting Results
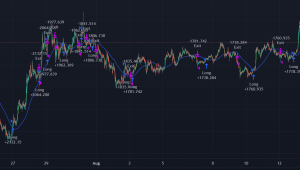
This strategy was backtested on TradingView which can be found on the Coinrule TradingView account (Trader Coinrule — Trading Ideas & Charts — TradingView). The strategy can be tested on historical data, and adjusting the parameters such as percentage of coin purchased from portfolio to better fit your needs. On TradingView, the strategy works well on MATICUSDT on the 1-hour, 15/45-minute timeframe, and AVAXUSDT pair on the 1-hour and 45-minute timeframe, and ETHUSDT on the 4-hour timeframe. Shown below are the backtesting results taken from TradingView for MATICUSDT on the 15-minute timeframe:
Didn't find any solution?