Category
- Trading Academy
- Get Started
- Exchanges Guidelines
- Trading 101
- Master TradingView
Oversold Reversal Optimised - How To Improve Your Entries In A Strategy With RSI
The main principle of trading is to buy low and sell high. That it’s quite easy to say in theory, but in practice, it’s totally another story!
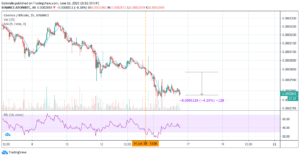
One common indicator that people use to try to spot when the price conditions are oversold is the RSI. When the indicator approaches values of RSI of 30 or lower, that usually point at oversold conditions, this is what theory says. In practice, if you buy “blindly” when the RSI is lower than 30, you could find yourself stuck in a trade in loss.
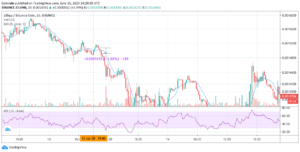
Following this principle, you would have bought ATOMBTC when the RSI was just below 30, but as you can see, the price dropped reaching values around 18!
How To Improve The Entries?
What I like to do is to combine the use of the RSI with a short term moving average. The moving average I prefer to use for this purpose is the MA(9).
The beauty of this strategy is that, not only you can spot the oversold condition, but before entering into the trade, you can wait at least for a sign of a trend reversal. We would enter with the price above the MA(9) and still with a low RSI, to have plenty of upside to selling the position in profit.
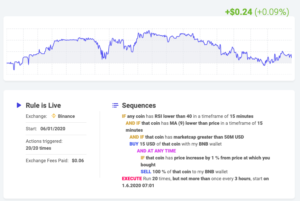
Generally, this works quite well. You can read more about this strategy here. The rule perfomed better in times when the market was trending up, and then strated to underperform when Bitcoin dropped dragging lower the whole market.
I will go through some examples of trades that are executed on the market.
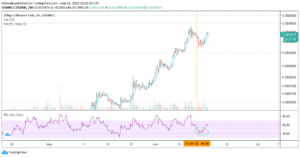
Firstly, with MATICBNB the rule worked perfectly. We have a low RSI, combined with the price above the MA(9). You can see that we managed to catch a 1.5% price increase precisely.
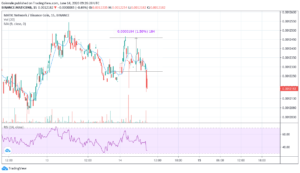
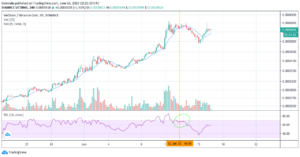
Then, in another trade with VETBNB the position was closed too early. In fact, the take profit at 1.5% got filled, but the price went up 4.4%.
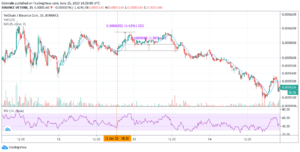
Instead, with ZILBNB the price had a minimal rebound, only to slide lower immediately after. The stop loss was filled, and I am quite happy that the stop loss was in place because the prices moved on the downside thereafter, dropping around 10%.
The optimised oversold reversal strategy
Let’s see how we can filter out, even more, these cases where the rebound isn’t strong enough to close the trade in profit. That would optimise the entries to make sure that the point at which I get the signal is an excellent point of price reversal.
Something interesting that I noticed is that if we zoom out a bit the chart on a four-hour time frame, the RSI was quite low. That means that there wasn’t enough power for the trend to push higher.
On the other hand, as you can recall from the previous case where the bot provided a perfect entry point on VETBNB, in that case the RSI has a much higher value, which means that there the trend has still a strong momentum. When the price is still trending upward, there are more chances to get a trade in profit.
So, these are the cases that I prefer to catch up with my strategy. Of course, my plan will trade less, but hopefully more efficiently.
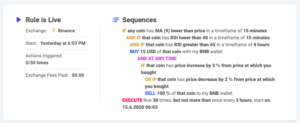
Combining these elements, I built another strategy to try to improve the buy signals. Therefore, to optimise the entries of my strategy, I add an additional condition to enter into the trade only if the RSI is trending on a larger time frame.
Trade safely!