Category
- Trading Academy
- Get Started
- Exchanges Guidelines
- Trading Tips
- Master TradingView
Moving Averages
A moving average (MA) is a technical analysis indicator calculated as the average of prices in a particular period. The shorter the period, the more the derived line will follow the price closely, instead, with a larger period the indicator can offer a better vision about the primary trend.
The daily price movements can be driven substantially by emotions and many other variables that don’t carry significant effects in the long term, so using one or more moving averages is an attempt to isolate the chart from this noise focusing only on the macro picture.
How To Use Moving Averages
As the price of the asset trades above the MA, its slope turns positive. That is an early indicator that an uptrend is forming on that time frame. On the other hand, the price dropping below the MA represents a sign that the uptrend is weakening and it could turn into a reversal.
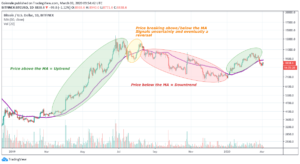
That visual representation provides a handy guide for traders about the state of the market. Why is this so important?
In times of uptrend, the choice of buying has always a better risk/reward profile. The opposite is true in times of downtrend. Selling always provides better opportunities.
Moving Average Crossover
Since the price incorporates a higher degree of volatility, it would be useful to use a short-term, or fast, MA as a proxy of the price. Using two MAs crossing increases the confidence in the signal as it reduces the noise effect of daily price moves.
A bull reversal is in place when faster MA crosses from below a slower one. That is a typical buy-signal.
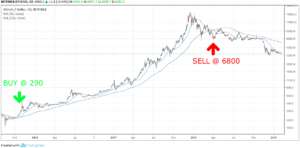
In the above example, we used two MAs. One is calculated taking into account 50 daily close prices, and the other 200 daily close prices. As it’s easy to notice, the MAs appear as smoother lines, changing their slopes less often that the price chart.
Looking at the first chart above, according to this strategy you would have bought BTC at the end of 2015, considering the 50 MA crossing above the 200 MA. In this way, you would have fully enjoyed its parabolic price surge until 2018. The sell-signal was provided by the 50-days MA crossing from below the 200-days MA.
The results are impressive, just one trade would have returned more than 20 times the original investment in only about two years.
A 2000% return is indeed a remarkable performance, and it was achieved executing just one buy order and one sell order. What if we set up our indicators to provide more trading signals?
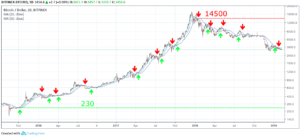
In this second example, we used the 20-days and the 50-days MAs. What happens is that the two lines appear less smooth and their intersection happens more often. Each of these crossings indicate more short-term buy and sell opportunities for those that want to exploit at best the trend.
As we can see, if we used this strategy we would have had a buy signal earlier than in the previous example with a slower MA (first buy executed at around $230 vs $290) and we could have sold at a higher price ($14500 vs $6800). However, on the other hand, we would have entered more trades. Some of them wouldn’t have been profitable, and they would have lowered your overall return.
How to trade with Moving Averages on Coinrule
You can set up an automated trading strategy based on Moving Averages just in a few simple steps with Coinrule.
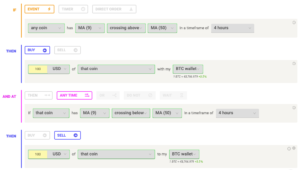
The first step is to set up the condition that will trigger the orders. The block allows you to define a specific crossover of the price with an MA (eg. if the price crosses above the MA-50) or the crossover of two MAs (eg. if the MA-50 crosses below the MA-100).
The time frame defines the periods that are used for the calculation of the MAs. If you set the condition to run based on the MA-50 in a time frame of one hour, the bot will calculate the average of the previous 50 hours.
Here follows the example of a classic Golden Cross strategy on a medium-term time frame.
It’s worth noticing that you can run a rule based on the price moves of a specif coin, or on many different coins. The parameters of this rule are optimized to catch trend reversals on all the coins available on the market. More coins mean more opportunities!
For each of the buy orders generated by the first condition, the bot will check the proper conditions to sell the coins when a sell-signal is generated. Read more about the Any Time operator in this example.
The rule can generate frequent signals, to avoid over-trading, make sure to limit the frequency of the executions according to your preferences before launching the rule.
You will find more template rules based on Moving Averages when creating a rule.
Main Takes
We can now outline three main conclusions:
- Looking at the price trading above or below a Moving Average help understanding the strength of a trend.
- Moving Averages are indicators that have an intrinsic lagging nature, which means that it is impossible to identify bottoms and tops. We should use the indicators to interpret the Momentum and the underlining strength of a trend (both upward and downward) and to trade accordingly.
- Trying to reduce the lag of the indicator changing its parameters provides more signals. Out of these more signals, some will be very useful, some will be misleading. You can adjust the strategy adding more conditions to filter out the less interesting opportunities.
Comments are closed.
Comments: 2
Can I change the number of periods?
Hi Edoardo,
you can choose one of the periods available. Currently, you can select one of the following setting: 9, 50, 100, and 200.