Category
- Trading Strategies
- Get Started
- Exchanges Guidelines
- Trading Tips
Uniswap Market Analysis And Scalping Strategy - Ep 10
Market Analysis
Yesterday we saw panic in the markets as the price of Bitcoin was going down. Many began to think emotionally, believing that we will never see all-time highs again. However, if we move back a bit and look at the 4-hour chart, we can see that we are still trading between the range we observe for weeks.
As you can see on the chart this has been the pattern that Bitcoin has been following for the last 6 months, where we have an extended period of accumulation that is followed by a breakout, then accumulation once again.
Uniswap Market Analysis
All the Buzz is currently around Uniswap. Many where ecstatic to receive their airdrop of 400 UNI!
On the first day of trading, we saw the price had a range between 2.7 -3.6 USDT. The range then broke on the upside, reaching a staggering 8 USDT before beginning this long downtrend. We can see that the price is hovering above the previous resistance and using it as a support. The pattern that is shown here is similar to the chart of Monero that we have analyzed previously.
When looking at the chart, you can draw a head and shoulder just above the support. You can then use this to set the level at which you want your stop loss to operate. You can set it at the shoulder as the first option or at the head as the second option. At this point, we barely retested the shoulder and moved on to the upside. That is a positive indication.

How to build a suitable strategy

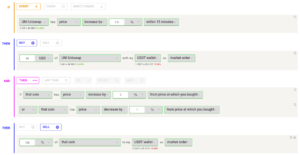
Based on Uniswap market analysis, this automatic strategy can take advantage of a new forming positive momentum. The rule is set to scalp Uniswap dips to avoid getting a long exposure to the asset to decrease the risk.