Category
- Trading Strategies
- Get Started
- Exchanges Guidelines
- Trading Tips
Scalp Ethereum Dips - Ep 3
Market Analysis
Yesterday we saw a huge drop in Bitcoin’s price, dropping by 20% from the highs. We then see the price consolidate at roughly $10,240 and continue to go sideways. Again, we see that when Bitcoin has strong price moves either up or down, sideways movement is followed. During this time of consolidation, we see Altcoins beginning to recover.
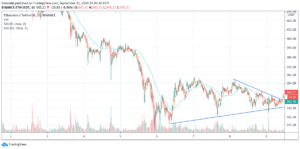
Looking at the Ethereum chart, we are just below a very key resistance, at the price of $360, that was tested several times today. If we plot the series of higher lows, we see an ascending triangle pattern emerging.

However, the bullish pattern is not guaranteed. That being said, after a substantial price drop, this does indicate a bullish pattern, where the price is swinging between high and lows. Based on the chart, the triangle should reach its Apex tomorrow.
How to build a suitable strategy

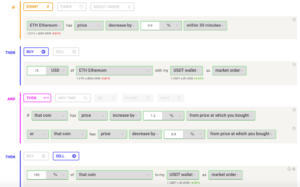
This is an automatic strategy that you can run whenever you notice a positive momentum in liquid coins like Ethereum. The rule is set to scalp Ethereum dips to avoid getting a long exposure to the asset to decrease the risk.