Category
- Trading Strategies
- Get Started
- Exchanges Guidelines
- Trading Tips
Buy And Sell Bitcoin In Range - Ep 2
Market Analysis
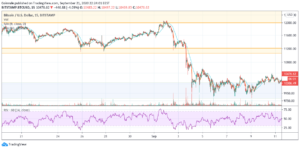
It is essential to see is that we had a consolidation area for basically all August that eventually broke on the downside and found, for now, a support with a very crucial area.
This local top represents this key area, and it was the higher bound of the accumulation area that we saw between May and July around the end of July when it broke out on the upside. So the charts, for now, say that this is a crucial area. It was a key resistance area. Technical Analysis theory says that if an area is an extreme resistance eventually should also provide support in the future.

We now see a retest of the $10,100 area, and resistance levels are critical when there is an uptrend. The price always is eventual shakeout on the downside.
That’s because the market is testing how buyers are willing to keep buying when the price goes down. So that’s why a support area is very crucial. So, now what I would expect looking at the chart is that if this level can also see some sideways moves here or eventually a retest of 11,000 then in the coming days if this proves as support.
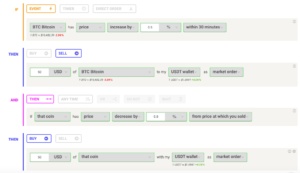
How to build a suitable strategy

This is an automatic strategy that you can run whenever you notice a negative sentiment in the market and volatility decreases on Bitcoin.